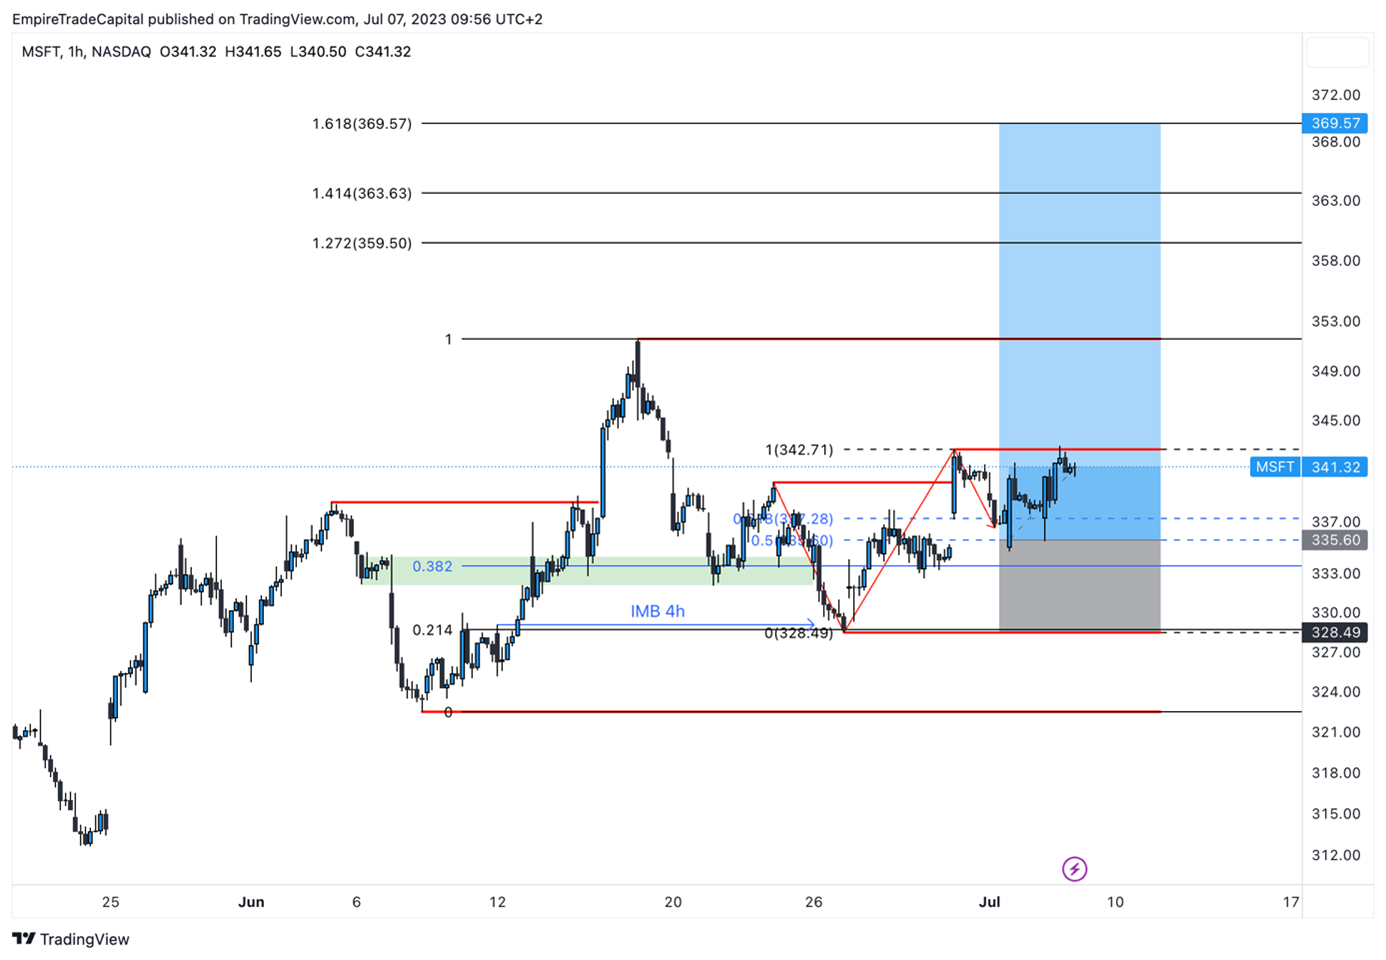
Of all the major companies that can be traded, it was Microsoft that caught my eye the most. In fact, since the beginning of the year, it has risen in value by as much as 50% and was at the key level of $340 per share[1]. * Based on all these aspects, I decided to take a closer look at this market through the eyes of technical analysis.
In terms of the four-hour (4h) time frame, the market is very clearly in bullish structures and there has been a selection of the last Imbalance Zone, corresponding to the Fibonacci level of 0.214. * In such situations, it is necessary to detect structures in correction on an even lower time frame and wait for a break to our preferred direction. In this case, I waited for price to close above the lower peak on the fifteen-minute (15m) timeframe, and this would create confirmation to place a pending order. My preferred level is the 0.5 Fibonacci retracement level. I placed the stop loss (SL) order below the bottom level at 15m. The Take Profit (TP) is open because the price is at the All Time High (ATH) and thus has no obstacle in its way. However, to secure the potential profits already made I set the partial TP at the 369.57/1.618 Fibonacci sequence level. *[1]

* Past performance is no guarantee of future results
[1] Forward-looking statements are based on assumptions and current expectations, which may be inaccurate, or on the current economic environment, which may change. Such statements are not guarantees of future performance. They involve risks and other uncertainties that are difficult to predict. Results may differ materially from those expressed or implied by any forward-looking statements.
[1] Link to 5-year performance: https://tradingeconomics.com/msft:us


