The last month has been one of consolidation for the U.S. dollar, which for me as a trader means "vacation." When the market is in the so-called range zone, it has the effect of building liquidity by retail traders who want to enter the market at any cost. There are times in the market when you can trade and other times when you can't! It is necessary to recognize this difference because the number 1 priority of a consistent trader should be to protect their capital.
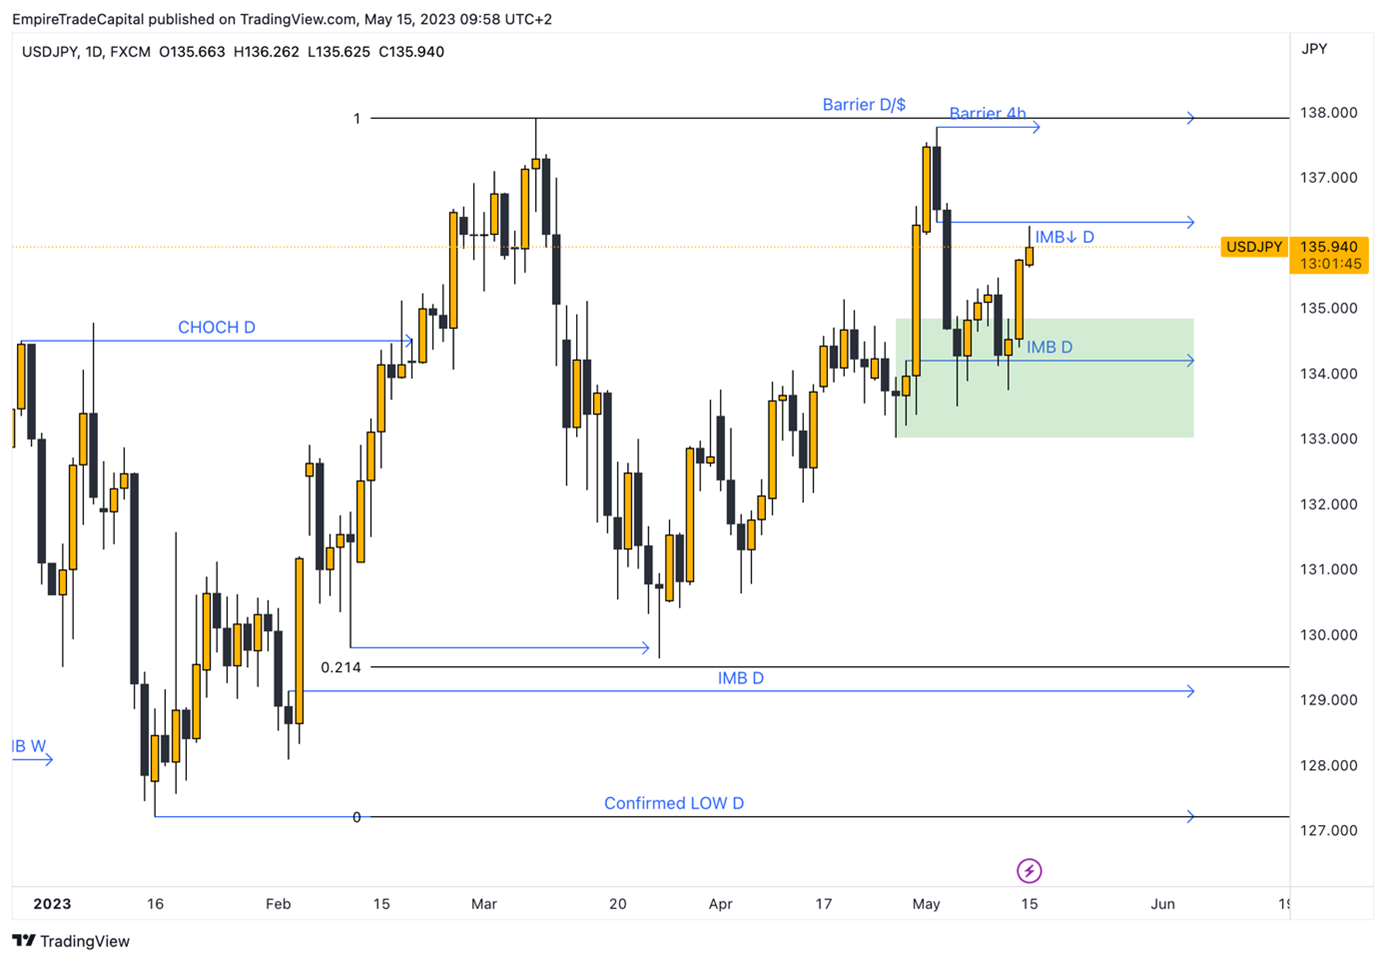
USD/JPY - This market is currently very attractive from my point of view, both fundamentally and technically. The market structures are bullish on all fundamental time frames - weekly, daily and 4-hour. Another key factor that attracted my attention was the daily Imbalance zone. It was tested four times during the correction, and not once did the daily candle close below this level (on the chart - the green rectangle.) *

Link to 5-year chart: https://www.investing.com/currencies/usd-jpy
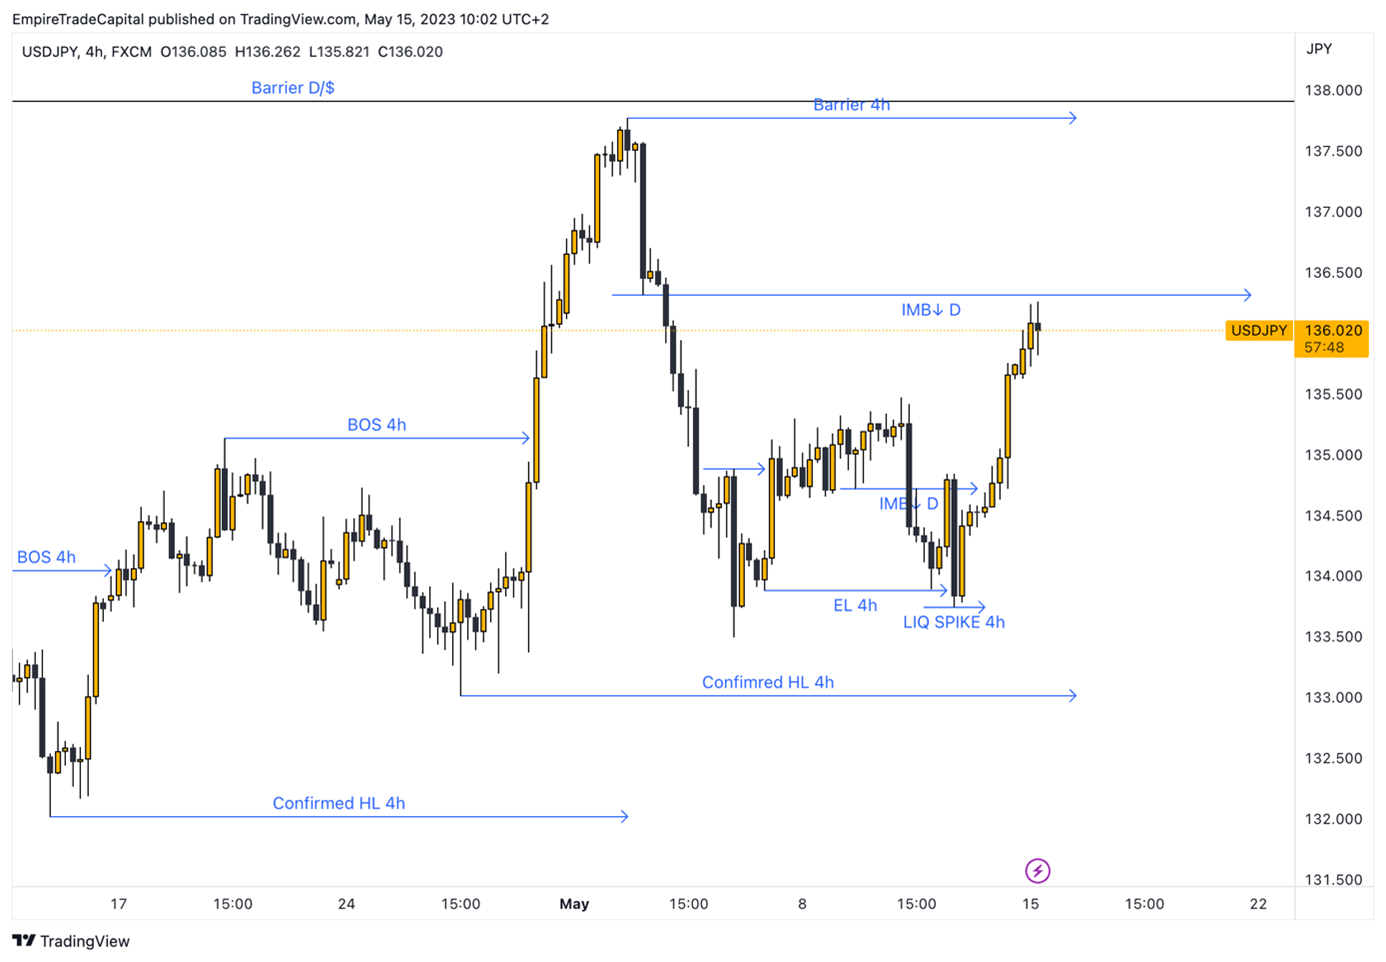
If the market shows all these aspects, my next step is to wait for an entry set-up. This consists of two or more equal lows and a subsequent short-term decline below those lows. By doing this, the market will indicate to me that the early buyers have been kicked out of the market and the banks have executed their trades. A last criterion of my trading system, in this case, is a bullish Momentum candlestick. This one will confirm the strong buying pressure that I want to be a part of. In the chart below, you can see that the market has met all the criteria mentioned. *

Link to 5-year chart: https://www.investing.com/currencies/usd-jpy
What is important right now is how the price behaves at the daily Imbalance zone of 136.3. Since I want to buy this market, I need to see a corrective bearish Price flow because of weak Seller’s strength. The price on the 4-hour timeframe may eventually drop to 133.015 but may not close below it. That would imply a transformation to a bearish structure, and the buying set-up would be invalid. [1]
The stop-loss order of the trade will depend on further developments. Now, we can say that a conservative level would be 133.743 - the zone of the last liquidity spike. [2]
The take-profit is set at 137.911. The reason for that is there are two equal highs above which the liquidity of the traders who sold and the price will want to kick them out of the market. The Retail Traders Sentiment Index shows 62% of traders with an open short position in this market. This fact confirms my assumption. [3]
* Past performance is no guarantee of future results
[1,2,3] Forward-looking statements are based on assumptions and current expectations, which may be inaccurate, or on the current economic environment, which may change. Such statements are not guarantees of future performance. They involve risks and other uncertainties that are difficult to predict. Results may differ materially from those expressed or implied by any forward-looking statements.


