🍪 Cookies

We use cookies to store, access and process personal data to give you the best online experience. By clicking Accept Cookies you consent to storing all cookies and ensure best website performance. You can modify cookie preferences or withdraw consent by clicking Cookie Settings. To find out more about cookies and purposes, read our Cookie Policy and Privacy Notice.

Cookies settings


Cookie Control

What are cookies?

Cookies are small text files that enable us, and our service provides to uniquely identify your browser or device. Cookies normally work by assigning a unique number to your device and are stored on your browser by the websites that you visit as well as third-party service providers for those website. By the term cookies other technologies as SDKs, pixels and local storage are to be considered.


If Enabled

We may recognize you as a customer which enables customized services, content and advertising, services effectiveness and device recognition for enhanced security
We may improve your experience based on your previous session
We can keep track of your preferences and personalize services
We can improve the performance of Website.


If Disabled

We won't be able to remember your previous sessions, that won't allow us to tailor the website according to your preferences
Some features might not be available and user experience reduced without cookies


Strictly necessary means that essential functions of the Website can not be provided without using them. Because these cookies are essential for the properly working and secure of Website features and services, you cannot opt-out of using these technologies. You can still block them within your browser, but it might cause the disfunction of basic website features.

  • Setting privacy preferences
  • Secure log in
  • Secure connection during the usage of services
  • Filling forms

Analytics and performance tracking technologies to analyze how you use the Website.

  • Most viewed pages
  • Interaction with content
  • Error analysis
  • Testing and Measuring various design effectivity

The Website may use third-party advertising and marketing technologies.

  • Promote our services on other platforms and websites
  • Measure the effectiveness of our campaigns

Trader's Diary

Economic calendar

{{ item.title}}
{{ item}}
Definition of terms:
Earnings

Earnings

refer to the profits or net income generated by a company during a specific period.

  • Earnings are a measure of a company's financial performance and are often reported on a quarterly or annual basis.

  • Positive earnings indicate that a company has made a profit, while negative earnings indicate a loss.

  • Earnings can be influenced by various factors, such as revenue, expenses, taxes, and other financial activities.

Code

The code is a unique identifier assigned to a company's stock by the stock exchange where it is listed. It is used to identify the stock in trading and other financial transactions.

Actual

Actual refers to the real or current value or result of something. In the context of IPOs, actual can refer to the actual price or number of shares sold in the IPO, as opposed to the estimated price or number of shares.

Estimate

Estimate refers to a prediction or approximation of something, such as the expected price or number of shares in an IPO. Estimates are often made by investment banks and analysts based on market demand and other factors.

Difference

Difference refers to the numerical or percentage variance between two values. In the context of IPOs, difference can refer to the variance between the estimated and actual price or number of shares sold in the IPO.

Percent

Percent refers to a fraction of 100, often used to express a proportion or rate. In the context of IPOs, percent can be used to express the difference between the estimated and actual price or number of shares sold as a percentage of the estimated value.

close icon
IPOs

IPOs (Initial Public Offerings):

An IPO occurs when a private company sells its stock to the public for the first time to raise capital or money.

The money raised from an IPO can be used for various purposes, such as paying down debt, investing in the company's long-term health, research and development, expanding into new product lines, or purchasing fixed assets.

During the IPO process, the equity shares of private investors

convert into publicly owned shares of the new entity, and early investors may sell their stock once the company's shares begin trading.

The chief benefit of an IPO is to help the company raise money and gain access to the capital markets, allowing for expansion and increasing credibility.

Code

The code is a unique identifier assigned to a company's stock by the stock exchange where it is listed. It is used to identify the stock in trading and other financial transactions.

Name

The name is the official name of the company whose shares are being offered in the IPO.

Exchange

The exchange is the stock exchange where the company's shares are listed and traded. Examples of stock exchanges include the New York Stock Exchange (NYSE) and the Nasdaq.

Currency

The currency is the type of currency in which the company's shares are priced and traded. This can vary depending on the country and stock exchange where the company is listed.

Start date

The start date is the date on which the company's shares begin trading on the stock exchange after the IPO.

Offer price

The offer price is the price at which the company's shares are initially offered to the public in the IPO. This price is set by the company and its underwriters based on market demand and other factors.

Shares

Shares refer to the units of ownership in the company that are being offered to the public in the IPO. These shares can be bought and sold on the stock exchange after the IPO.

close icon
Splits

Splits (Stock Splits):

A stock split occurs when a company increases the number of its outstanding shares of stock to boost the stock's liquidity.

In a stock split, the number of shares outstanding increases by a specific multiple, but the total dollar value of all shares remains the same.

Companies often choose to split their stock to lower its trading price to a more comfortable range for most investors and increase the liquidity of trading in its shares.

For example, if a company decides to split its stock 2-for-1, the number of shares outstanding would double, while the share price would be halved.

Code

The code is a unique identifier assigned to a company's stock by the stock exchange where it is listed. It is used to identify the stock in trading and other financial transactions.

Split date

The split date refers to the date on which the stock split takes effect. It is the date when the new shares resulting from the split are distributed to existing shareholders. Optionable

Optionable refers to whether the stock is eligible to be used as an underlying asset for options contracts. If a stock is optionable, it means that options can be traded on that stock.

Old shares

Old shares refer to the existing shares of a company before a stock split takes place. These are the shares that will be exchanged for the new shares resulting from the split.

New shares

New shares are the additional shares that are issued to existing shareholders as a result of a stock split. The number of new shares is determined by the split ratio, such as 2-for-1 or 3-for-2, where shareholders receive a certain number of new shares for each old share they own.

close icon
Week {{ activeWeekInfo }}
{{ days[index] }}
{{ dateFormater(i.date) }}
{{ i.next_month }}
{{ i.prev_month }}
Earnings
Earnings
{{ dateFormater(i.date) }}
close icon
{{ getCurrency(key) }}: {{ a }} - {{ currencySymbol }} %
Diary
Diary
{{ dateFormater(i.date) }}
close icon
Read more
or

IPOs
IPOs
{{ dateFormater(i.date) }}
close icon
{{ getCurrency(key) }}: {{ a }} - {{ currencySymbol }} %
Splits
Splits
{{ dateFormater(i.date) }}
close icon
{{ getCurrency(key) }}: {{ a }} - {{ currencySymbol }} %

EUR/USD - Imbalance zones are key

Date: 12.6.2023

During the weekend, when trading in the markets is suspended, there is room for in-depth technical and fundamental analysis of selected markets. Given that my primary market is the US Dollar (USD) itself, I analysed this market. Starting from higher time frames, such as daily and weekly, I was intrigued by certain contexts that made my attention even more riveted, and consequently, I was looking forward to Monday's opening of the markets.

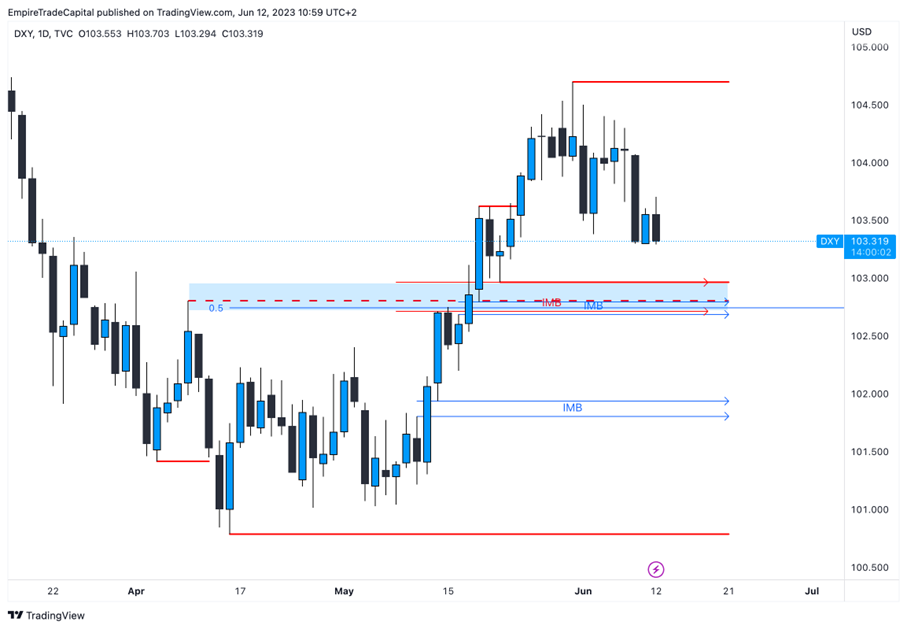
May was marked by strong buying pressure for the USD. As the market moves in patterns, it is always possible to expect some correction after a strong move upwards/downwards. In this case, on the daily time frame, 8.6, the USD formed a sharp bearish candle, one of many signals indicating the start of a correction. [1] I see the daily Imbalance (IMB) zones around the 102.7 and 101.8 levels as potential correction targets. The 102.7 zone has several factors that may make it very attractive in price. In addition to being a daily IMB zone, it is also a weekly one. Further, it is important to mention that these zones correspond with the previous structure point and the 0.5 Fibonacci (FIB) level.
1

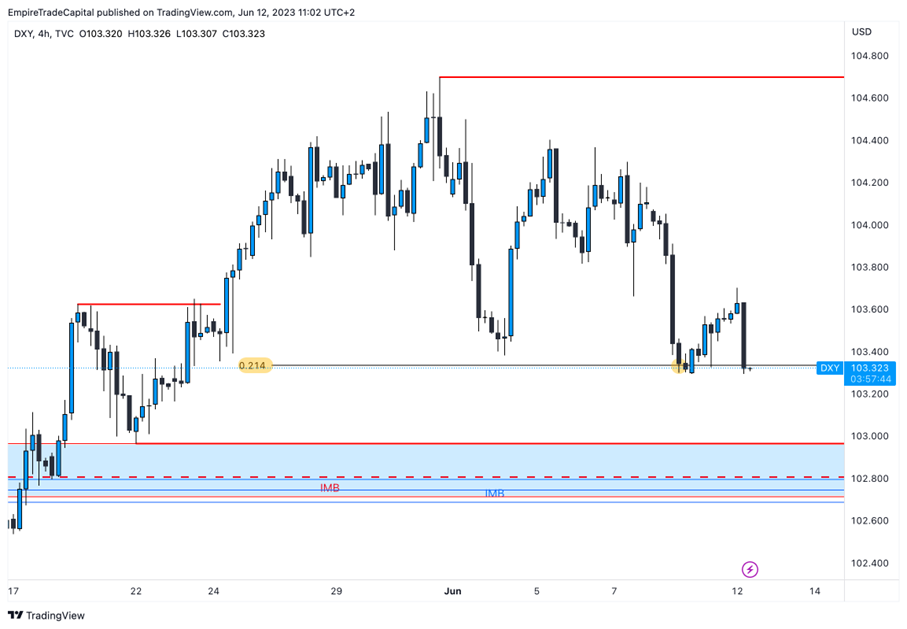
In terms of the four-hour time frame, the price is still in a bullish structure, but the 0.214 Fibonacci level has already been tested. Subsequently, I observed a corrective Price Flow, indicating a lack of buyers' strength.
2

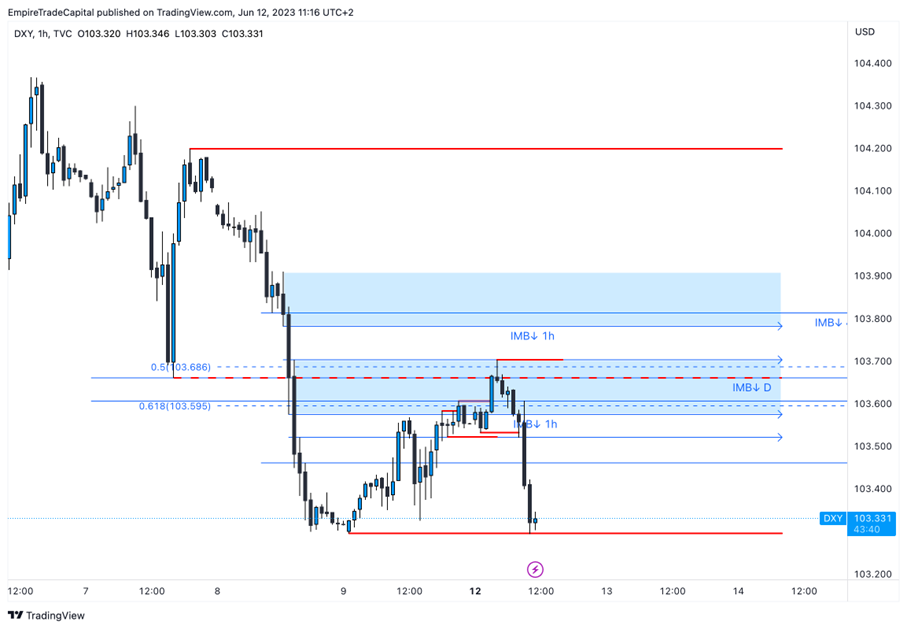
Shifting my analysis to the one-hour time frame, I noticed that the price "broke" on the bearish structure, which, along with other factors, is a very favourable situation for me, as I would like to sell the USD. I have identified several Areas of Interest (AoI,) in which I would like to execute my trade. The most attractive was the one around the 103.6 level. There were the daily and one-hour IMB zones and the 0.5/0.618 FIB levels.
3

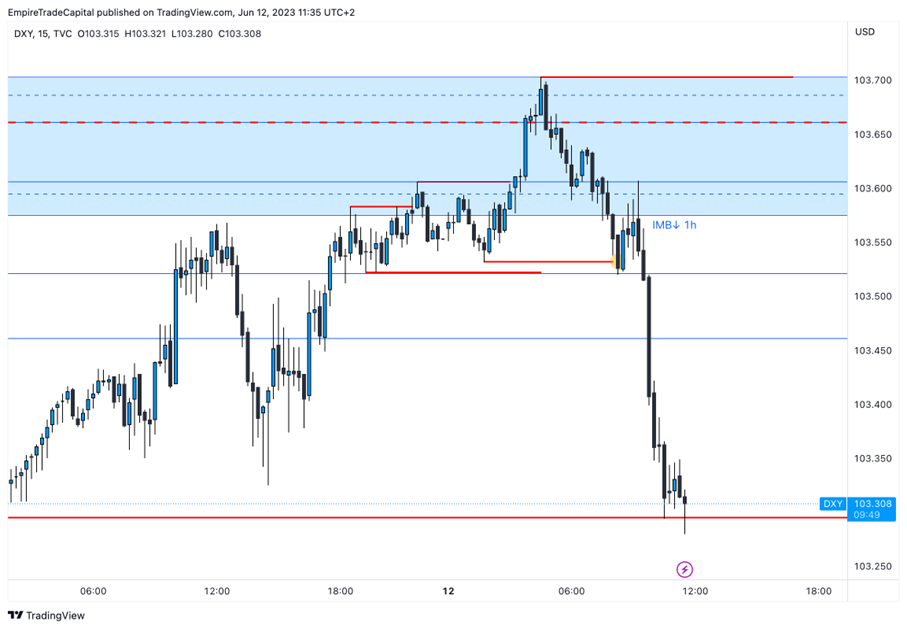
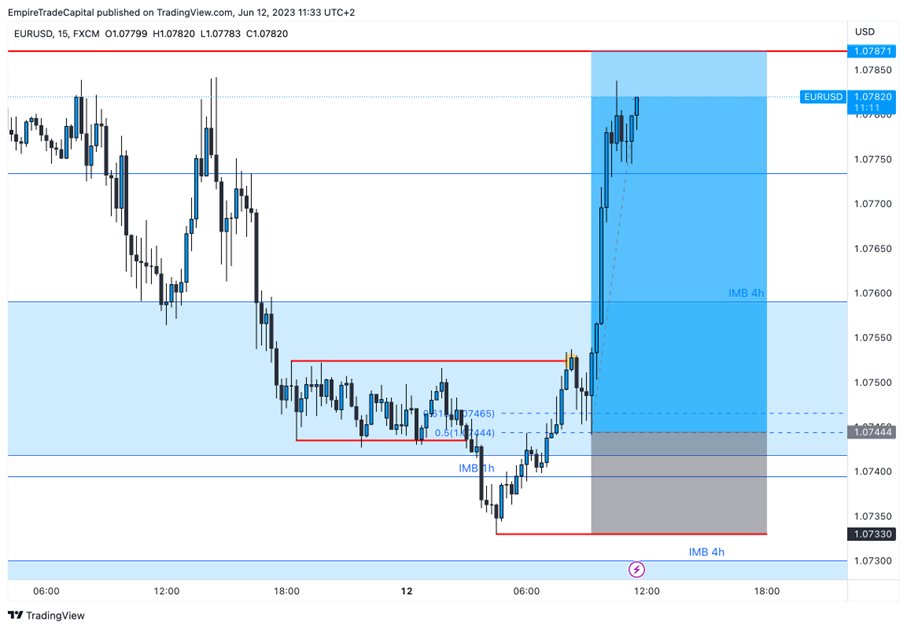
I always wait for confirmation of movement on smaller time frames before entering a trade. With this setup, I waited for the price to "break" below the Higher High (HH) on the 15m chart. This did happen, and I had an open path to enter the trade at that point. EUR/USD is the market that correlates the most with DXY. So, I opened the EUR/USD chart and placed a pending order at the 0.5 FIB level because of the more lucrative Risk Reward Ratio - the ratio of risk to the potential reward.
4

5

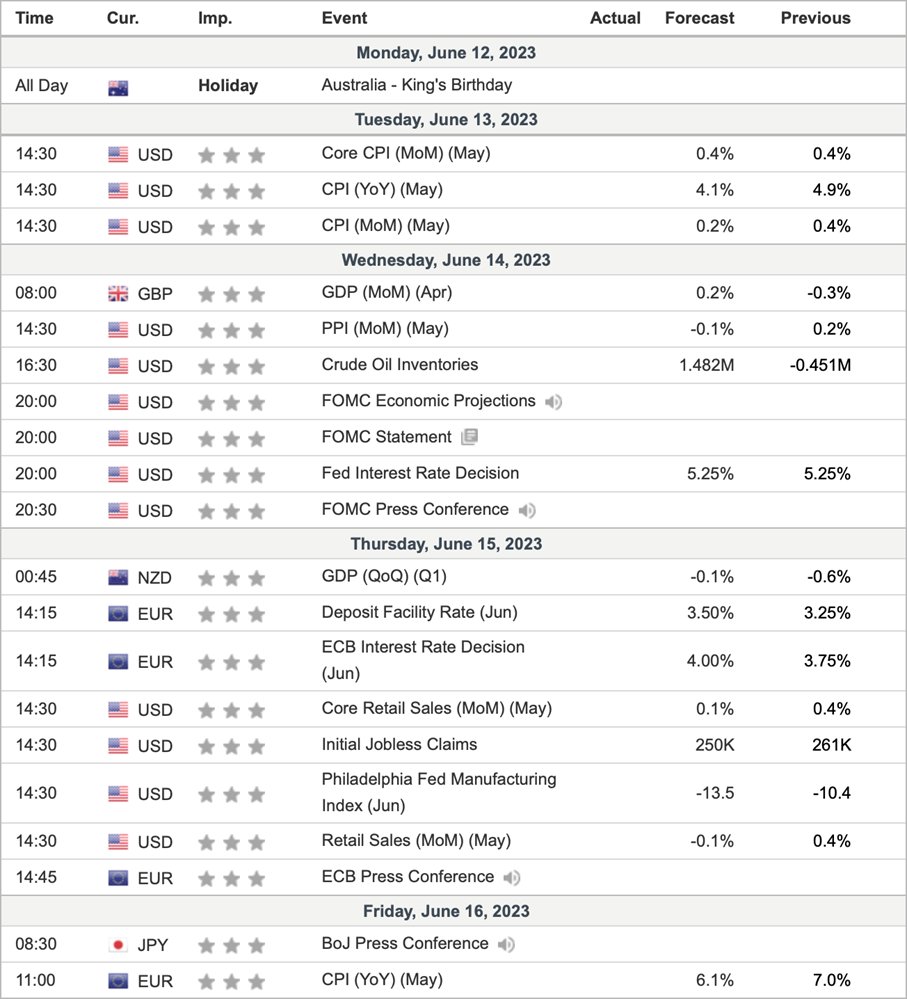
I closed the trade with a profit of 3.7 RRR/7%. I didn't want to leave this trade open longer than today as there will be many macroeconomic reports announced, which will sharply increase volatility in the markets.
6

[1] Forward-looking statements are based on assumptions and current expectations, which may be inaccurate, or based on the current economic environment which is subject to change. Such statements are not guaranteeing of future performance. They involve risks and other uncertainties which are difficult to predict. Results could differ materially from those expressed or implied in any forward-looking statements.

Date: 20.11.2024
Qualcomm Expands Horizons Beyond Smartphones: I'm Buying This Promising Player at a Low Price

Today I took the time to analyze Qualcomm Inc. (NASDAQ: QCOM) in detail, which seems to be on a very interesting development trajectory. As the world's largest seller of smartphone processors, the company recognizes the need to diversify its business and find new sources of growth, which leads me as an investor to think more deeply about its future potential.

Date: 13.11.2024
Shopify's Growth Signals the Strength of Its Transformative Strategy

Today, I followed the market with a particular interest in Shopify Inc. (NYSE: SHOP), a company that has become synonymous with e-commerce over the years. Looking at their latest financial results and strategic moves, it's clear that their transformation into a platform for larger businesses is bearing fruit.

Date: 6.11.2024
Nvidia Overtakes Apple as the World’s Largest Company: The AI Boom in Full Swing

Today, I find myself reflecting on Nvidia Corp.’s (NASDAQ: NVDA) meteoric rise to become the largest company in the world, surpassing none other than Apple Inc. Nvidia’s stock rose 2.9%[1] to $139.93, pushing its market cap to an astonishing $3.43 trillion, overtaking Apple’s $3.38 trillion valuation.* To put this into perspective, Microsoft, which Nvidia already surpassed last month, holds a valuation of $3.06 trillion. What stands out to me is how artificial intelligence has fundamentally reshaped Wall Street’s landscape, with Nvidia emerging as the clearest beneficiary of the AI revolution.

Date: 30.10.2024
OpenAI and Broadcom’s Strategic AI Chip Development

Today, I've been closely following the news about OpenAI's plans to collaborate with Broadcom Inc. on its own AI chip, designed specifically for inference – the process of running AI models after they've been trained. This potential game-changer is attracting the attention of the tech world, as OpenAI seeks to develop a solution focused on responding to user requests rather than traditional training dominated by Nvidia's graphics processing units (GPUs).

Date: 23.10.2024
Texas Instruments in the Third Quarter of 2024 – Hope for Recovery?

As part of this week, I analyzed the third-quarter results of Texas Instruments Inc. (NASDAQ: TXN), which provide an interesting insight into future developments in the semiconductor sector. Even though the company announced the eighth consecutive decline in sales, the tone of the outlook is in an optimistic spirit, which signals the potential for a recovery in demand soon.

Risk warning: CFDs are complex instruments and come with a high risk of losing money rapidly due to leverage. 92.59% of retail investor accounts lose money when trading CFDs with this provider. You should consider whether you understand how CFDs work and whether you can afford to take the high risk of losing your money.