US100 - Daily Time Frame
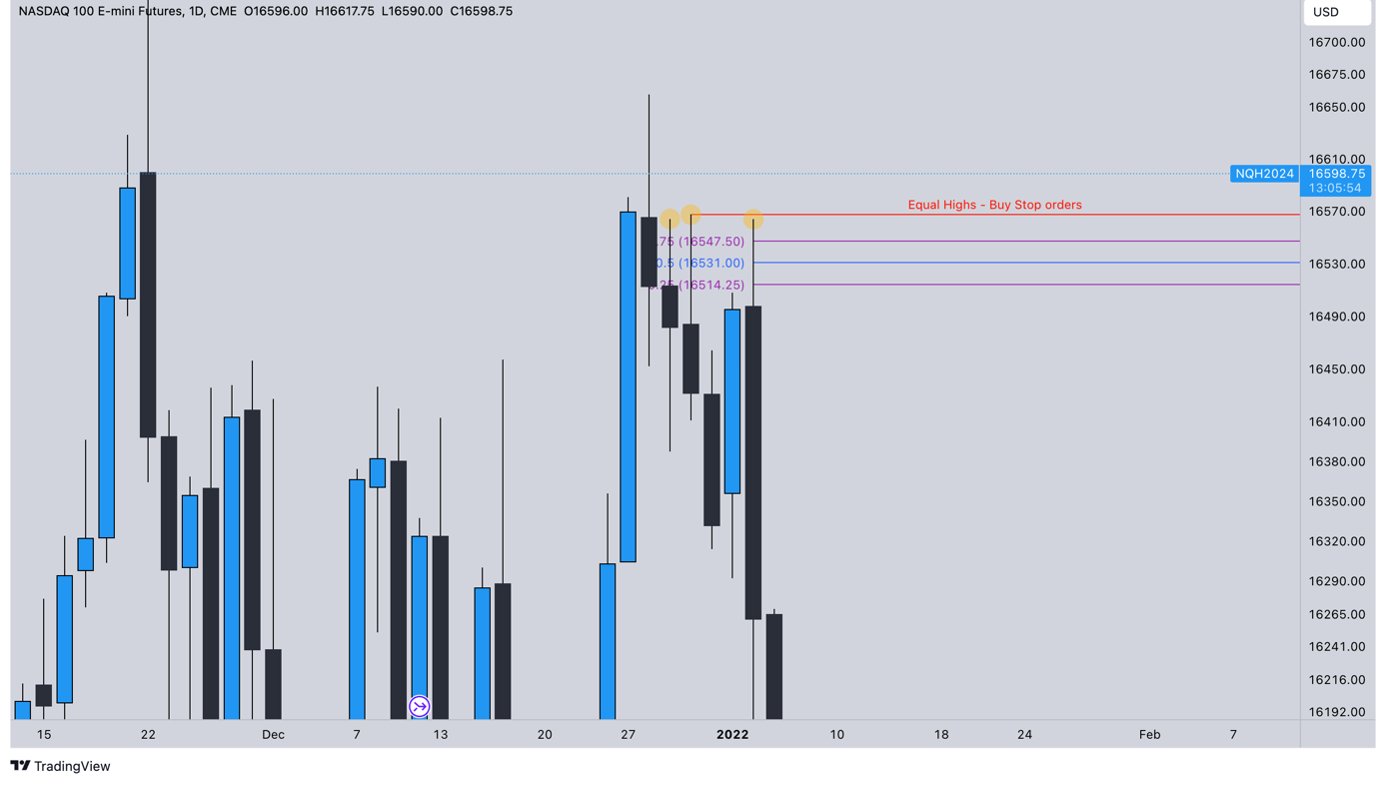
The data release was scheduled for 14:30 (UTC+1). An hour before that, I started my technical analysis and laid out my targets for where the price may be headed. On the daily chart, I found a very interesting zone that contained three Equal Highs, above which there was liquidity in the form of Buy Stop orders, as traders selling at this level have their Stop Loss set as a Buy Stop. If large financial institutions want to sell, they will need a counterparty, and it is these Buy Stop orders that will provide that liquidity.
An additional parameter was the candle wick, which I divided into 4 quadrants. Because wick is perceived by algorithms just like gaps.

*
US100 – 15m Time Frame
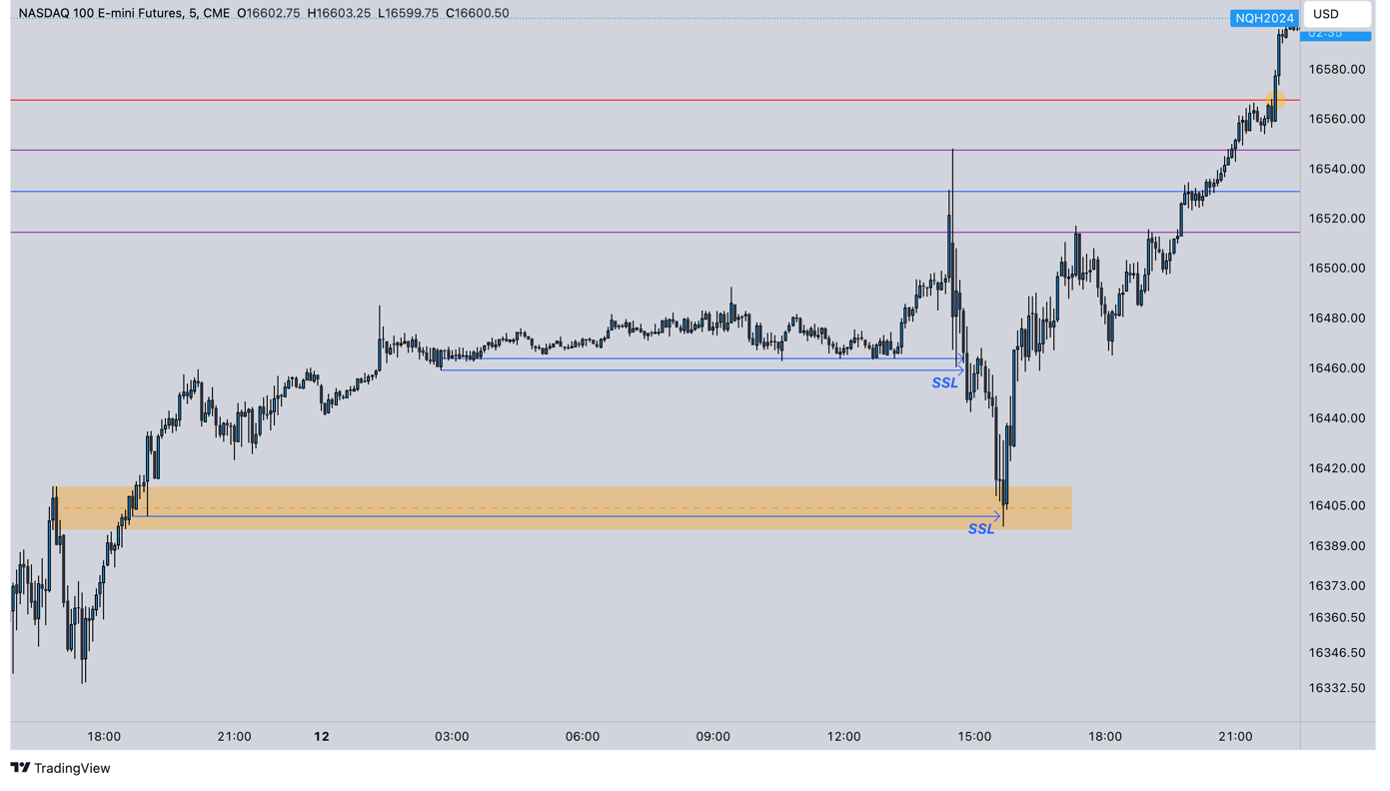
A few minutes before 14:30, the price rose, headed for the levels (4 quadrants of the wick) from the daily timeframe and reacted very precisely to them. It is important to note that since the morning price was in the Range zone with liquidity accumulation -> Sell Stop orders taking place at the bottom (Traders who bought early protected their positions with Stop Loss - Sell Stop orders). As the price rose just before the announcement, even more buying Retail traders joined the market with their Stop Loss below the Range zone.
After the announcement, the price dropped, took out a Liquidity -> Sell Stop orders and headed to the $16,400 level from which it bounced and continued to rise to the Equal Highs that I had indicated on the daily timeframe. *

*
* Past performance is no guarantee of future results.


