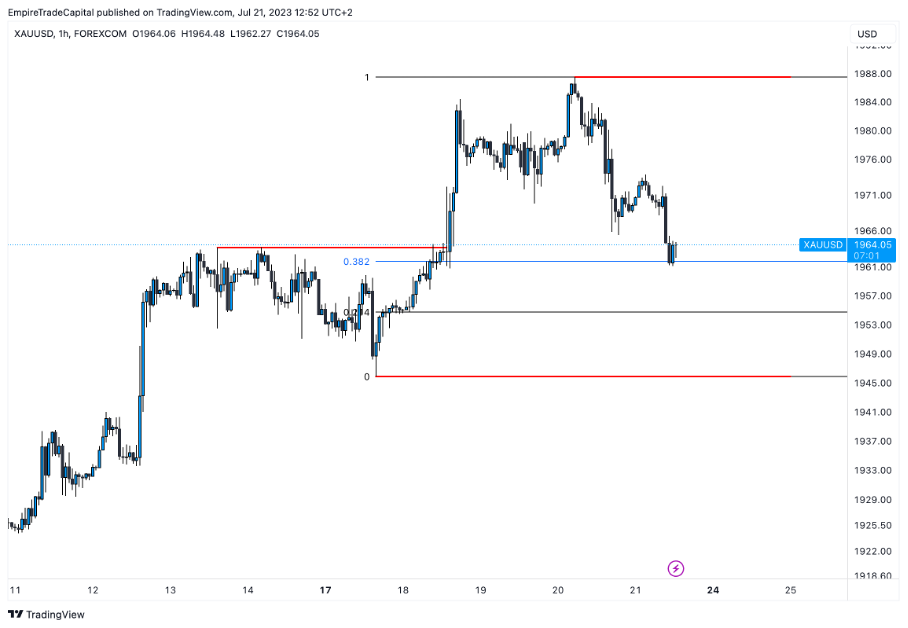
In late May, the price climbed to the so-called All Time High (ATH) and subsequently began to form a corrective bearish move, attracting traders into the market to sell at a high price. * When I looked at the four-hour time frame (4h TF,) I saw very clear bullish structures inside of which the price is moving up impulsively. That suggests to me that the sellers are in weakness, and I will want to buy in the context of technical but also fundamental analysis.
Currently, the price is at the 0.382 Fibonacci (FIB) level near the daily Imbalance zone. The last possible stop may be the $1955, which corresponds to the 0.214 FIB level. Should the price close below the higher low (on the chart - lower red line,) at the 4h TF, it would indicate the potential for a deeper correction in terms of the daily timeframe. [3]

* Past performance is no guarantee of future results.
[1,2,3] Forward-looking statements are based on assumptions and current expectations, which may be inaccurate, or on the current economic environment, which may change. Such statements are not guarantees of future performance. They involve risks and other uncertainties that are difficult to predict. Results may differ materially from those expressed or implied by any forward-looking statements.


